Quite often when structural engineers are viewing the analytical model within Autodesk Revit it can be a little difficult to see which members are fixed or pinned or have specific release conditions set. The standard way to achieve this is to select the analytical bar and then look in the Properties Palette for the information.
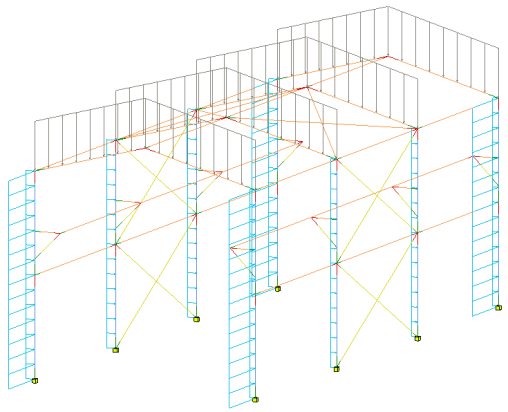
The image shown below is a typical representation of the analytical model with the loads and end colours shown.
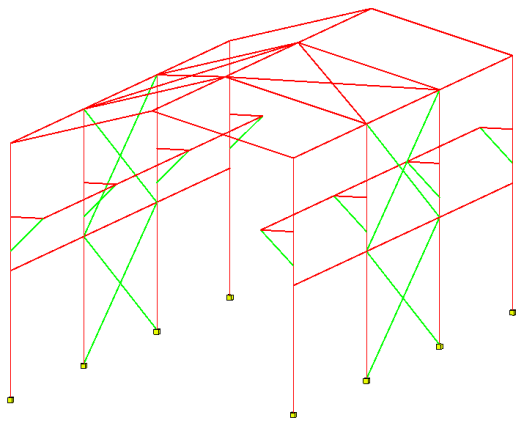
Here you can see the same model with some filters applied to help visualise fixed and pinned conditions.
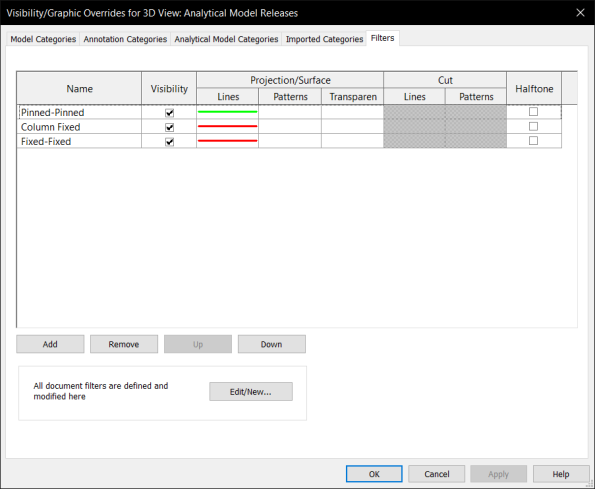
The filters are set within the Visibility/Graphic Overrides dialog box. In the example below, I have chosen to indicate a Fixed or Pinned condition by using the colours red and green. Note that I have also had to create a separate filter for columns.
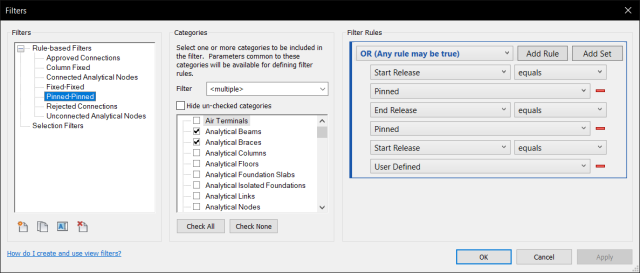
In the image below, you can see the new OR functionality being used to set a filter that either has the start or end release set to Pinned.
I would suggest that you create a separate view…